Home dashboard and revenue
See KPIs, charts, and plan usage on home for lists with Include in revenue dashboard turned on.
-
Step 1
What the home page shows
Current plan shows the subscription and Adjust plan. Records usage is how many lists you have vs the plan cap. For each list with Include in revenue dashboard: Total revenue, Billed entries, All entries, Avg / billed entry, Revenue trend, and Top revenue (billing groups).
Screenshots show the English workspace UI.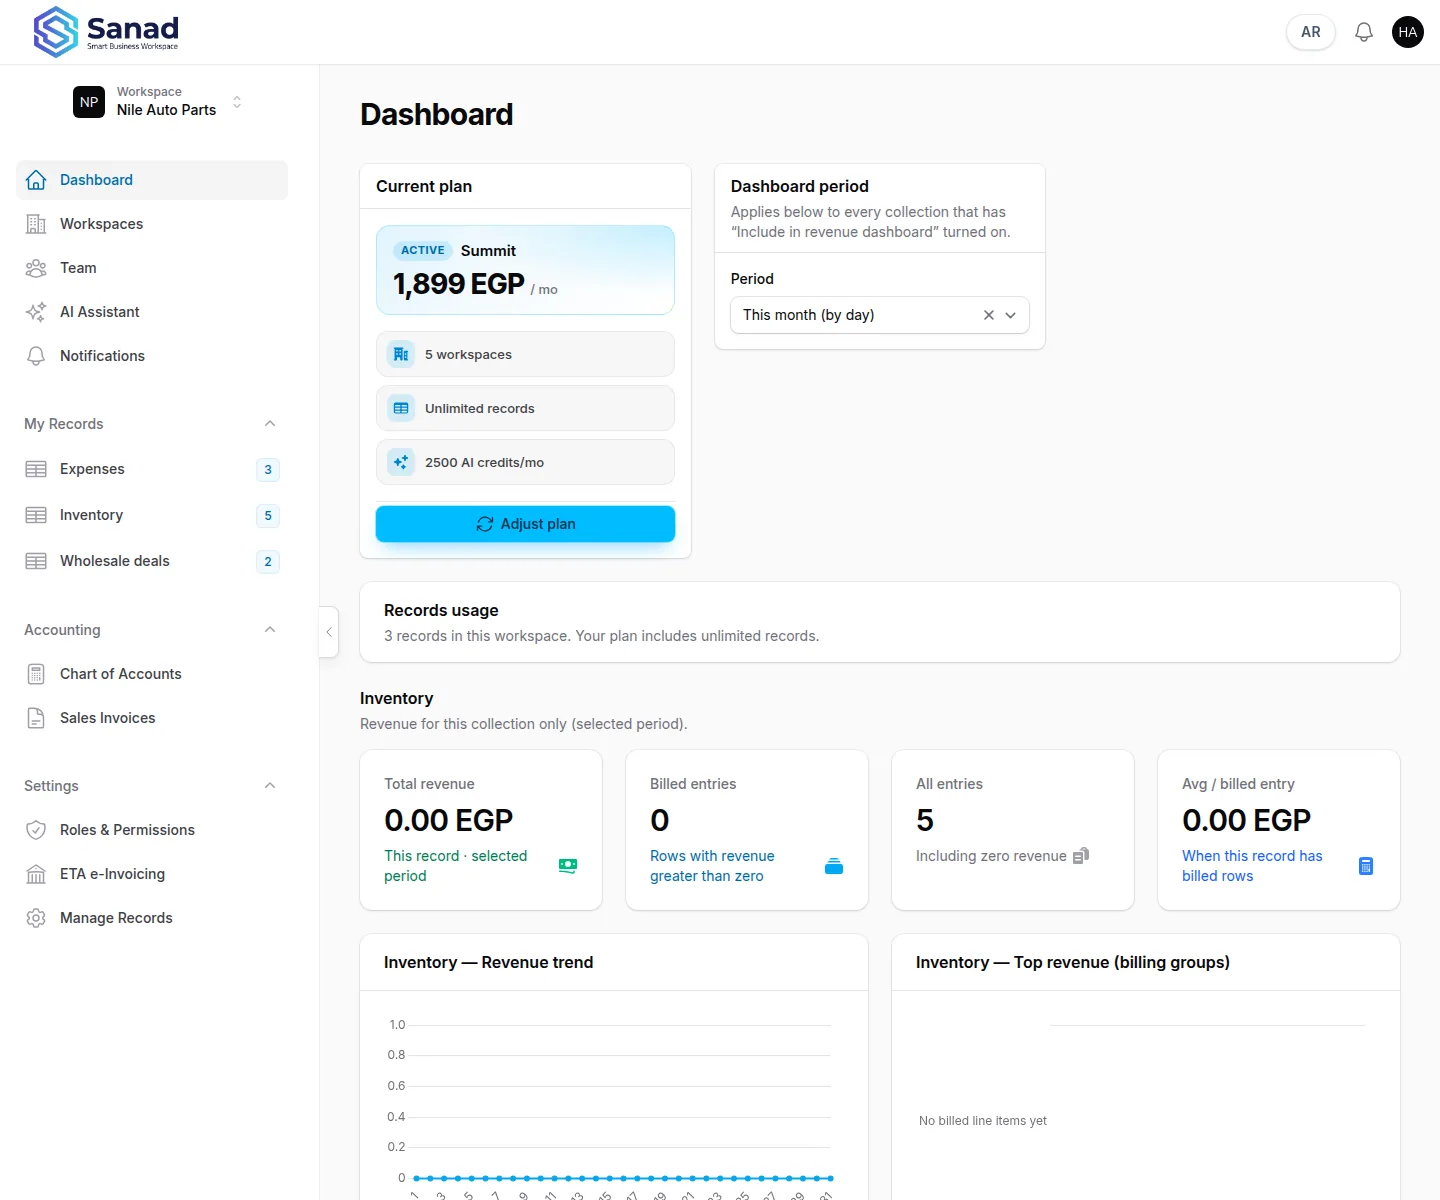
-
Step 2
Pick the period
Under Dashboard period, Period is Today (by hour), This week (by day), This month (by day), or This year (by month). It applies to every list with Include in revenue dashboard. Row revenue is quantity × unit price for billable number fields.
Screenshots show the English workspace UI.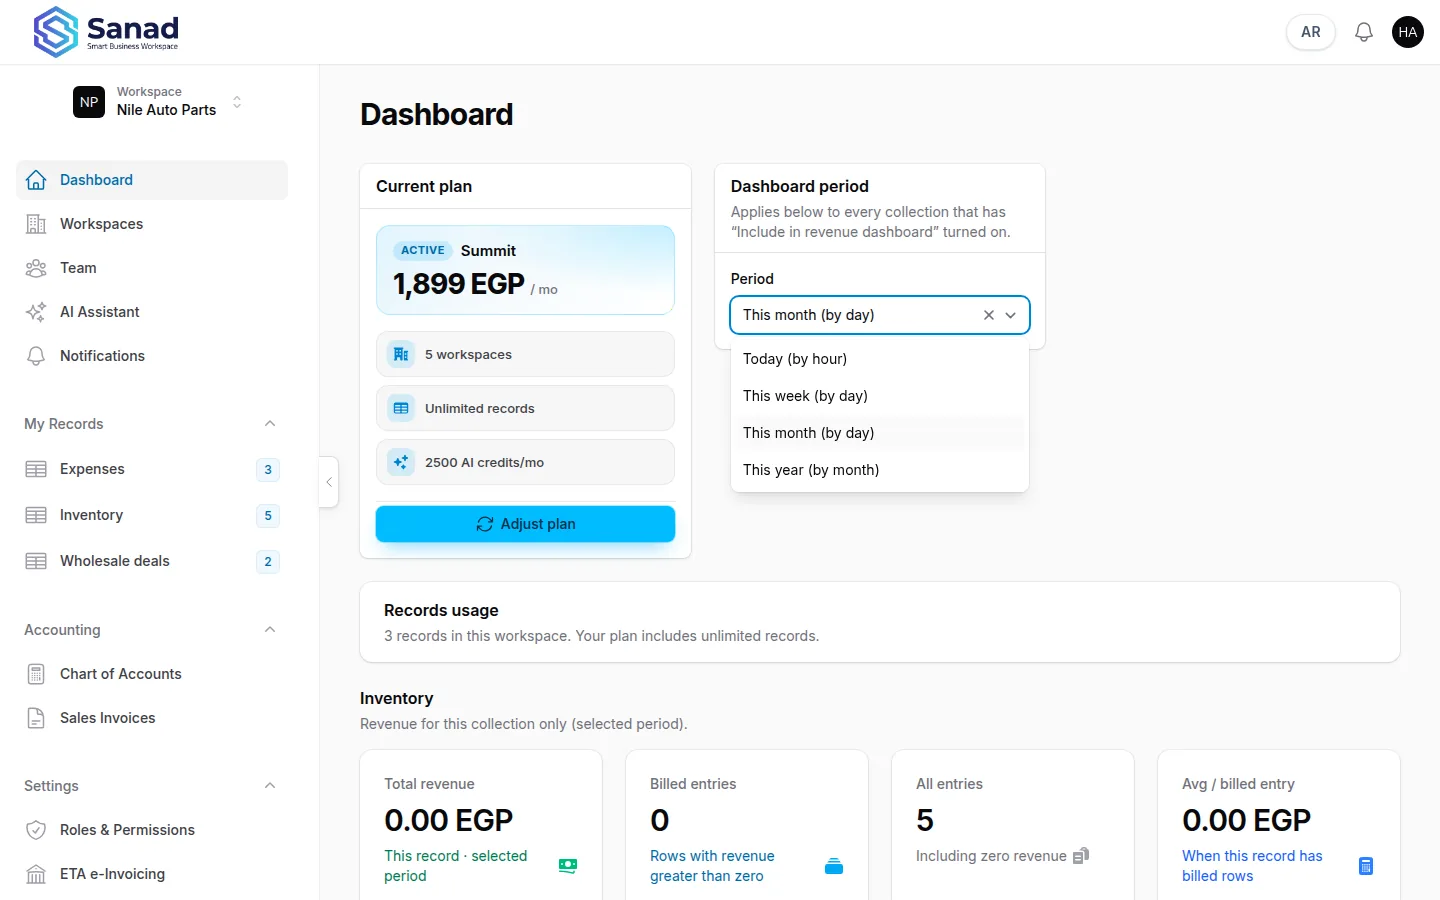
-
Step 3
If nothing appears
No data collections yet links to Create a record when the workspace has no lists. If lists exist but none are opted in, No revenue dashboards enabled links to Open Records so you can turn on Include in revenue dashboard.
Screenshots show the English workspace UI.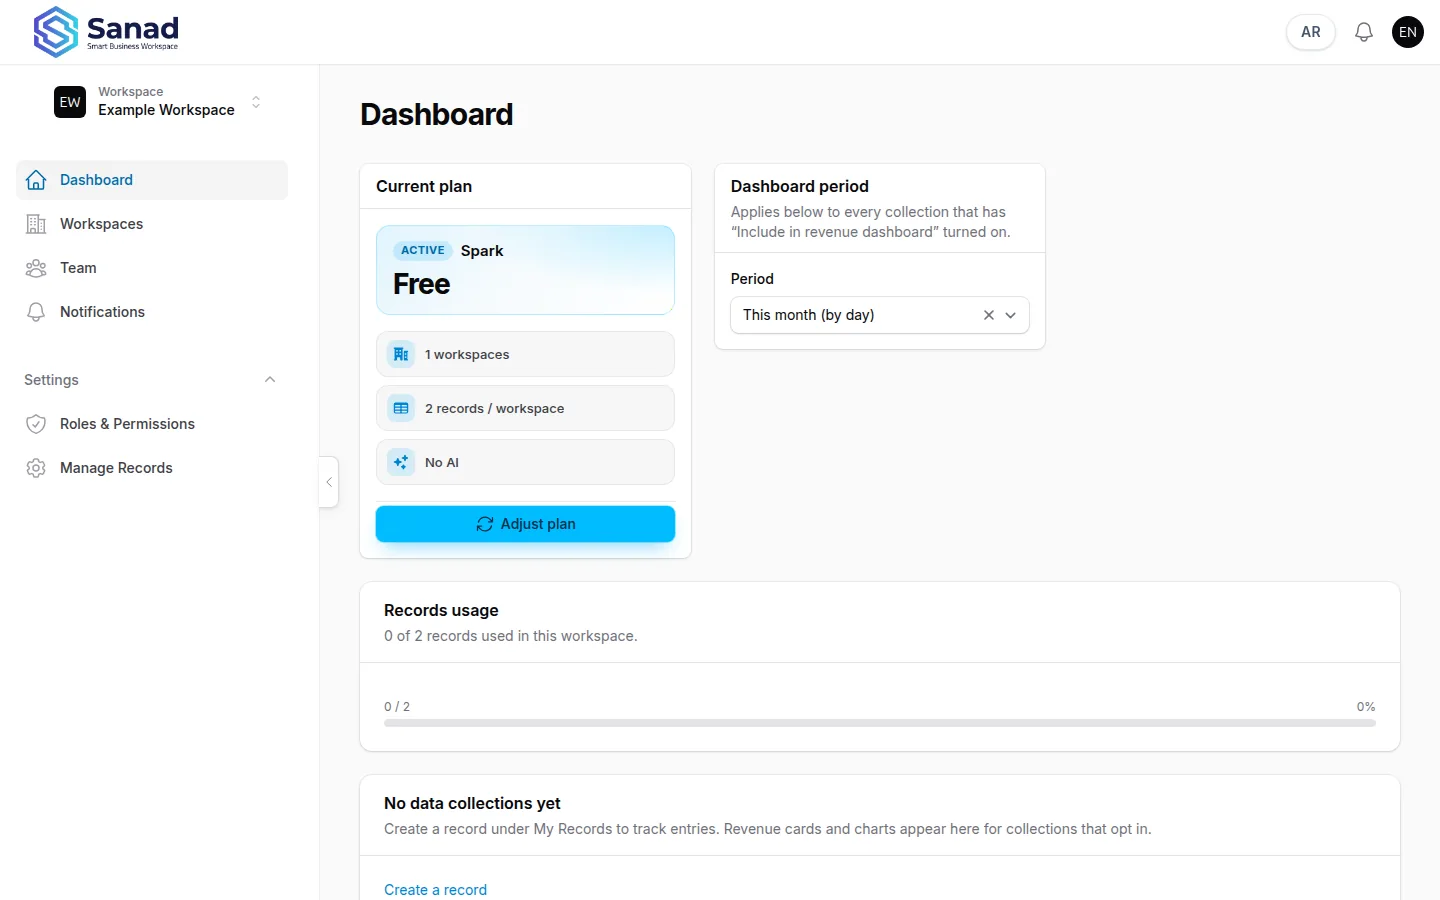
Related articles
Design a record list
Create a custom list: pick a template or start blank, set the name and dashboard options, add columns, then save. Daily entry is in My Records.
Plans and billing
What each plan unlocks, how to request a change, and what Pending payment means.
Create an account and first hour
Sign up, open the workspace as Owner, then fill the Business / invoice profile. Team, lists, and invoices have their own guides.